
What is CommoditiesChart?
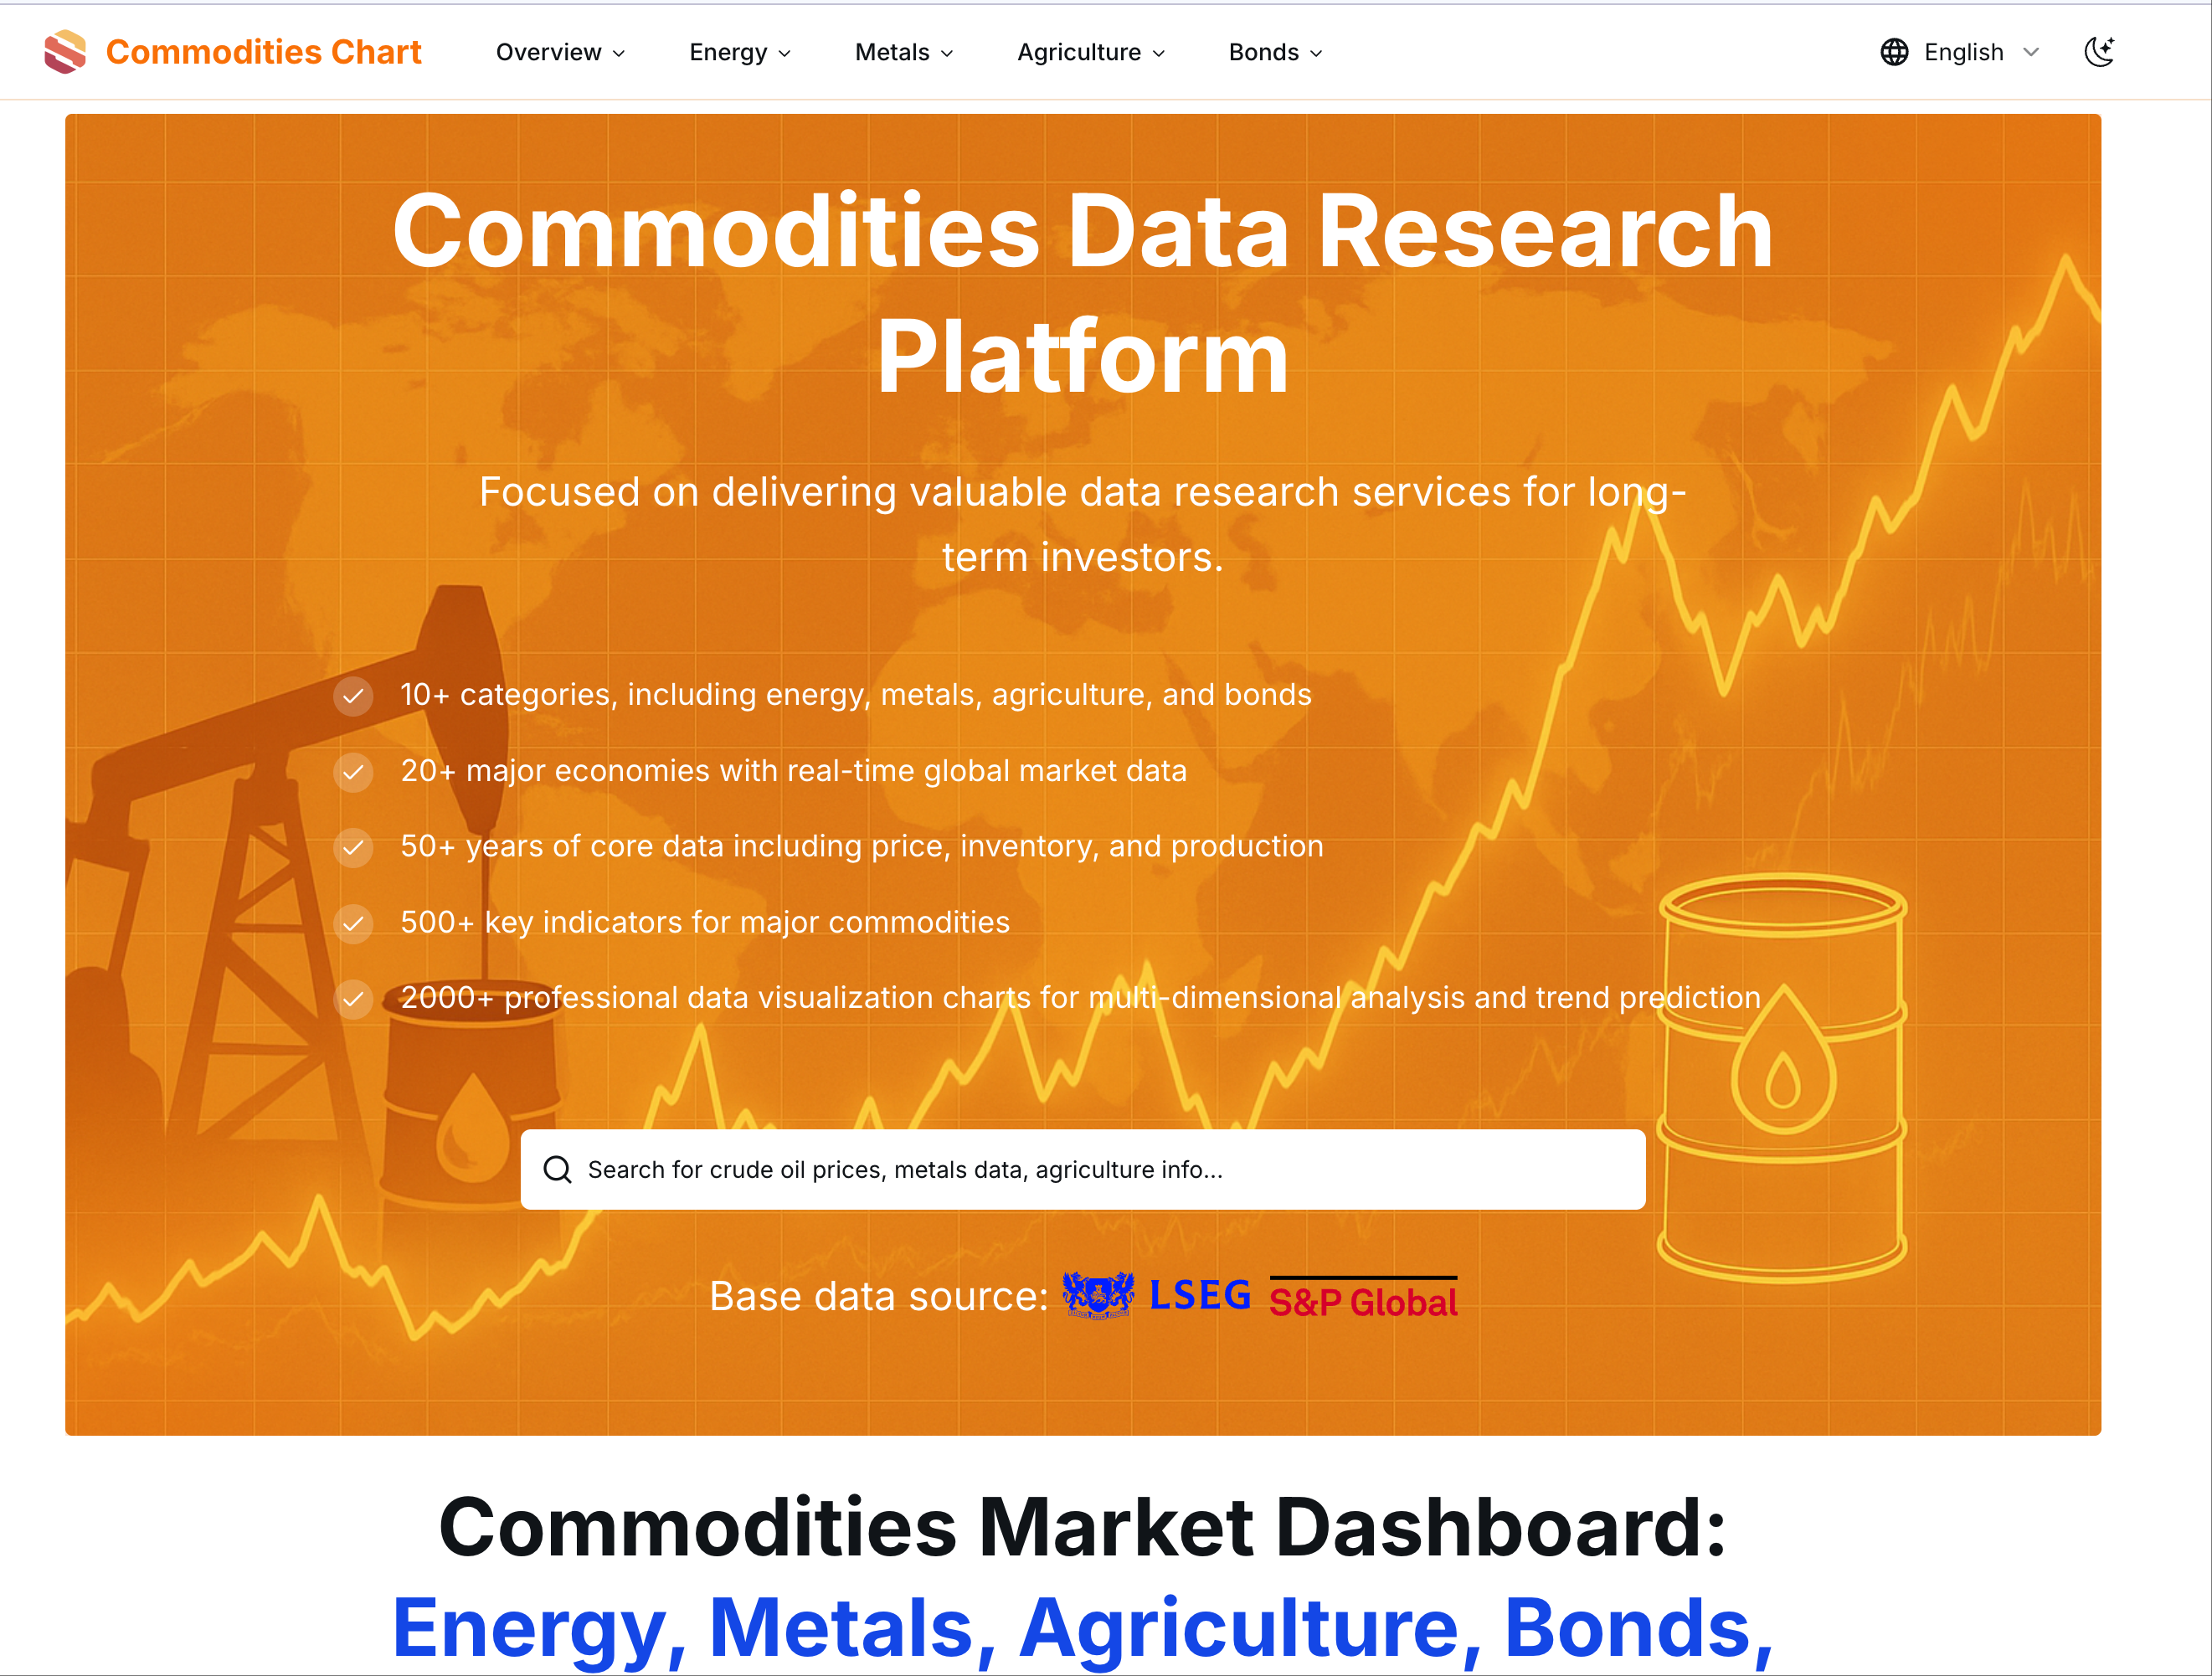
CommoditiesChart is a research site for commodity market data, built for independent commodity and macro investors. It presents historical commodity prices and related series, including crude oil prices, metals, agriculture data, inventories, Treasury rates and economic indicators, as charts that can be compared over long periods. Public data pages can be browsed without an account, and the site is available in English and Chinese.
Rather than presenting figures as live quotes, the platform focuses on verifiable context. Each series page explains what it measures, its units and its latest observation date, and it points to methodology and source references such as the U.S. Energy Information Administration. Tools like historical percentiles and long-run averages help place a current value within its sample, while signed-in users can build and save their own Custom Charts workspace.
Who it's for
- Independent commodity and macro investors
- Traders following energy and metals benchmarks
- Market analysts and researchers
- Students learning about commodity markets
How to use CommoditiesChart
- 1
Pick a sector
From the homepage or Markets overview, open a sector such as Energy, Metals, Agriculture, Bonds or Markets & Economy.
- 2
Open a series page
Choose a contract or dataset, for example WTI crude oil futures or ARA gasoline inventories, to view its chart, units and observation dates.
- 3
Read the context
Use the series explanation, historical percentile and methodology links to understand what the data represents before comparing it with other markets.
- 4
Save custom charts
Sign in to use Custom Charts and save a research workspace built from the supported series catalog.
CommoditiesChart key features
Commodities market dashboard by sector
Groups representative contracts across energy, metals, agriculture and macro context, with related charts linked from each benchmark.
Crude oil prices across benchmarks
Covers WTI, Brent, Murban, Oman, Dubai, ESPO, Sokol and other crude series, along with natural gas, RBOB gasoline and heating oil.
Inventory data and production series
Includes stock data such as ARA gasoline, gasoil and jet fuel inventories, plus oil production, trade and rig count sections.
Agriculture data
Tracks soybean spot prices for the US Gulf, Brazil and Argentina, Brazil soybean oil and CBOT corn futures.
Historical percentiles and long-run comparisons
Shows where the latest observation sits within the available sample, with notes that percentiles describe history rather than forecast returns.
Source and methodology notes
Each series page explains its definition, units and data cutoff, and the site offers a feedback form for reporting data errors.
CommoditiesChart use cases
Checking a WTI crude oil futures price history
Review the WTI chart alongside Brent, natural gas and gasoline to compare how energy benchmarks moved over time.
Framing metals in a macro view
Compare copper, gold and silver with Treasury rates and the Nasdaq to gauge industrial demand and safe-haven sentiment.
Tracking agriculture data for trade flows
Follow soybean spot prices in different origins to study seasonal pricing and regional differences.
Building a personal research workspace
Save a set of selected series in Custom Charts to revisit the same comparisons later.
CommoditiesChart FAQ
What is CommoditiesChart?
CommoditiesChart is a research platform that presents historical commodity market data across energy, metals, agriculture, rates and economic indicators. It is aimed at independent commodity and macro investors.
Is CommoditiesChart free to use?
Public data pages can be viewed without signing in. Saving a Custom Charts workspace requires an account.
Are the energy market quotes on CommoditiesChart live?
The site advises against assuming any value is live. Series update at different frequencies, and the latest observation date on each page marks the data cutoff.
Where can I find historical crude oil prices on CommoditiesChart?
The Energy section and crude oil pages cover benchmarks such as WTI, Brent, Murban, Oman, ESPO and Sokol, each with its own chart and observation notes.
How should I read inventory data on CommoditiesChart?
Inventory charts show stored volumes, not prices. The site recommends checking the product, geography, unit and reporting frequency before making comparisons.
Is CommoditiesChart investment advice?
No. The charts and explanations are intended for research and education, and third-party data may be subject to its own redistribution terms.
This introduction is based on the public pages of commoditieschart.net, read on October 9, 2026.